


Possibly the most used indicator out of the entire bunch, the Moving Average (MA) acts as a travelling support and resistance that any trader can see.
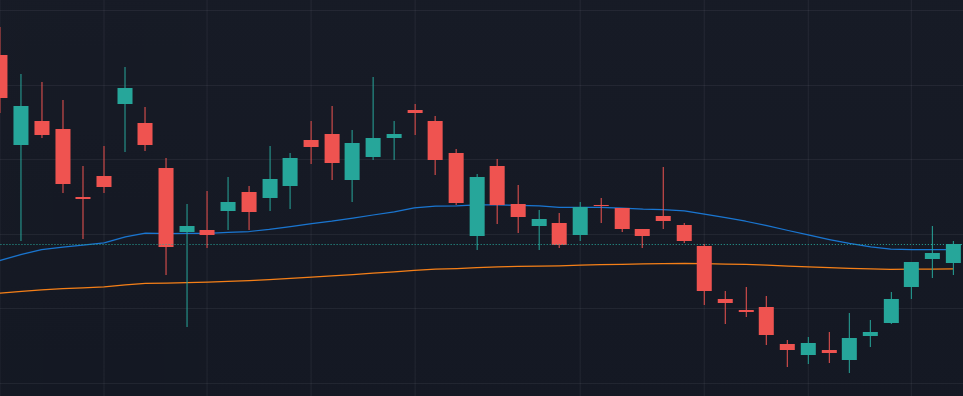
What’s a moving average? A moving average is simply an average of price data over the time frame you select. 200 day MA? Its the average of the prices over 200 days. 50 day MA? you guessed it. Data over 50 days. The beauty of MAs is that they are all completely customizable and at the discretion of the investor. Some day traders swear by the 21MA. Some love the 8MA. It all depends on what your style is and what works for you. The previously mentioned MAs (50 and 200) are the most commonly used. Lets see what they look like. The blue line is the 50MA, and the orange is the 200MA.

Your broker or platform will let you customize the color to your liking. Do yourself a favor and use the same color across all platforms.
Well, why does this matter? Why would anyone want these extra lines on their charts? These extra lines are often seen as supports and resistance by traders around the world. During times when the price is in a dead zone, void of a support or resistance, an MA may cross through the middle and provide a support to trade from.
In the chart below you can see the price stop and bounce right off the 50MA.

This bounce point wasn’t a previous support or resistance. It was purely that 50MA that gave the stock a support.
Watching for stock price crosses are also easy ways to trade with an MA. When a stock crosses below a 200MA (The orange line), that stock will typically see a reversal in its near future. See below.
When you see this happen, research the company. Has there been news? An offering? Find out why that stock may have dropped below the 200MA and then wait for it to consolidate and plan for a reversal. In this case, the stock bounced off a previous strong support and then drove back above the 200MA.
Another common way to trade with the MA is by watching when the MAs actually cross each other. When the 50MA crosses the 200MA to the upside, that’s the “Golden Cross” you may often hear traders speak of. A bullish trend will typically occur after that happens. When the 50MA crosses the 200MA to the downside, that’s a “Death Cross.” Obviously with a name like “Death Cross,” you can expect the stock to perform poorly from that point.
MAs are just another tool in the belt of a trader. They are very useful when you are doing research and studying trends, but they can also be very useful on a day trade basis. Supports can sometimes be hard to spot in the stock price, but its easy to see that big orange line running through your chart. Combine these with your trading style and your other indicators, and it will help you predict the way a stock may move in the future.