


The Relative Strength Index (RSI) is a commonly used indicator to track the momentum of a stock. It will give you an idea if the stock is reaching a critical pivot or reversal point. The key levels to remember are 30 and 70. These are your bumpers in a bowling alley. It will look like the chart below depending on which broker or site you choose. Don’t forget that you can add these indicators on your mobile apps as well. Don’t leave your tool belt at home.

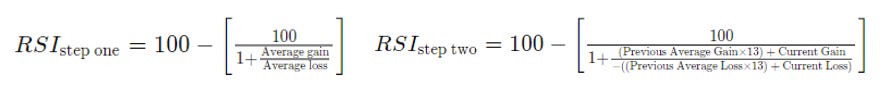
What is RSI? In basic terms, RSI is a calculation of a stock’s price action over the last 14 intervals. (If you’re looking at a daily chart, then 14 days. Hour? Well 14 hours. Minutes? 14 minutes. You get the idea.) The technical equation is in two parts below.
This equation will spit out a number typically between 20 and 90. The lower the number, the more likely the stock is oversold and the higher the number, the more likely its overbought. (Aka too low or too high when compared to the stock’s price history) For all indicators there are exceptions for this rule of course. Since we are on a 14 interval refresh, the RSI can become warped by a stock that is in a strong uptrend or downtrend. As with all indicators, this a tool in your belt, not a guarantee.
With that being said, if an RSI drops below 30 or above 70, you can typically expect a reversal. Lets look at it in chart form for a day trade scenario.

The chart above is on a 5 minute interval. As you can see, the RSI fell well below 30 early in the day at the first dip below $700. (The closer to 20 it gets, the higher the probability of a reversal)
At that point the stock was deeply oversold and reversed quickly after. When it hit the 70 mark on the RSI, it flattened out. Take a look at the whole day so you can see how RSI flows with the stock.

Always remember that it is an average of the previous 14 intervals. If you notice in the middle of the day at the point where the stock starts to level off, the RSI drops to normal levels around 50. Well why would it do that when $720 registered as a 70 on the RSI just 20 minutes earlier in the day? Remember that RSI is a 14 interval average, and this is a 5 minute interval chart. It will create a moving average based on the last 70 minutes. If a stock maintains a level for those 14 intervals, it will reset the RSI to a new “normal.”
RSI becomes more accurate when your time interval is longer. The longer the chart, the more data it averages.

The chart above is on a 1 day interval. Notice how the peaks on the chart trend above 70 on the RSI? Also notice how the steep uptrend from $2.5 to $5 was around the same 60-75 rating. Strong trends will warp the RSI. Be mindful and understand what you are reading.
This chart also shows how the price action is bouncing off the 30 on the far right, signaling an oversold reversal as it bounces off support. This would be the point that you would do some research on the company and decide if its time to take a starter position.
Combine this indicator with the Stochastic RSI and the MACD (same principles, different metrics) and you will be well on your way to understanding which stocks are undervalued or overvalued. Knowing that will allow you to know you’re buying closer to the bottom or selling closer to the top. Once you understand what the RSI is telling you, go back to older charts on a stock you plan on trading. You’ll find that it may help you predict the future.