


Understanding Level II
How reading the order book can help navigate stock volatility and price movement.

Many brokers and sites offer Level 2 data as a part of their subscriptions or accounts as a way to gain a little more information about what other traders are doing.
What is Level 2 data? Level 2 data is an order book. It is a constant stream of information that shows you what price people are trying to buy or sell a stock for and how many orders they are placing. Lets take a look at it in action so you can make sense of it.
This will look very different depending on what broker you use and what settings you choose.
Below is an example of $SPY’s research Level 2 data through TD Ameritrade. This is the most common type of Level 2. I will go over “trading” Level 2 in a moment.
From left to right:
Ex - The Abbreviation of the Market Maker (This is showing you who is placing the order.)
Bid - The price they are willing to buy the stock for.
BS - The number of orders at that price
Ex - Again - The Abbreviation of the Market Maker (This is showing you who is placing the order.)
Ask - The price they are willing to sell the stock for.
AS - The number of orders at that price

Pretty simple right?
So how do yo use this? The first thing you should look at is the number of orders. If you look at a Level 2 and see one side stacked vs the other, it will quickly let you know what MMs are trying to do.
If a stack of orders are on the Bid side (left), then that stock is most likely surging upwards, and vice versa if the Ask side is “stacked.” You may have heard that term before. Lets look at a very stacked Level 2.

When you look at the clip above, what do you see? Do you see the prices? Do you see the orders?
Look at the first row. Left to right. PHLX (Ex) is trying to buy 2 blocks (BS) at $16.31 (Bid). NYSE (Ex) is trying to sell 2 blocks (AS) at $16.34 (ASK).
Well where is the stacked part?
Look to the left side under the BS column. You can see 31, 20, 14, 2,1. All for a price of $16.30. That creates a “wall” of orders at $16.30 of MMs trying to buy. To the right, you can see that there are far fewer sell orders in the AS column. This creates a “stacked” bid, causing the stock to move upward.
Why would it move upward? Why does a lot of buy orders make a stock go up? Lets go back to fundamentals for a second.
If there are more people trying to buy than there are trying to sell, it makes the stock go up. Supply and demand right? Low supply (not many sellers) with high demand (A lot of people wanting to buy), means a higher price for the stock. You see this in the real world all the time. Lumber, houses, crops etc…
The Level 2 data fluctuates throughout the day as the stock price moves.
When you see one side get “stacked” all of the sudden, its usually a good representation of which way the stock is about to move.
Lets look at trading Level 2 that’s associated with the same research Level 2 clip above. This will be different depending on your broker. You can use the Trading Level 2 in conjunction with the Research Level 2 to simplify your workstation. See below.

Do you see how the Research Level 2 translates to the Trading Level 2? On the previous clip we could see 31, 20, 14, 2, 1, bid orders listed at $16.30. On this Trading Level 2, you see all of those added together on the same line at $16.30 represented by the 67 there in the green bid size column. (I know these add to 68, there’s a slight delay.)
Another useful side of Level 2 is the ability to see how “thin” the orders are. This can give you a sense of how fast a stock may move or how high (or low) it may go if there is a volume spike. See below.

The price of the stock above is $2.86. There is low volume and a wall at $2.85. Looking purely at this Level 2 data, you can see that this stock wants to bounce between $2.84 and $2.88.
What? How? These are just numbers.
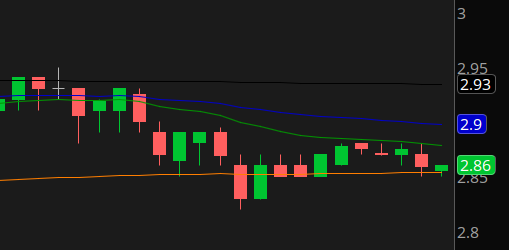
To see the range, look for skips in price. There are orders set for $2.85, $2.84, then a skip to $2.80 on the bid side. Then vice versa on the ask side, there are orders for $2.86, $2.87, $2.88, then a jump to $2.96! So between the jumps, you have consistent orders from $2.84 - $2.88. See the chart below to see it play out. The low point on the chart was $2.83 and the high point of this range over the last 15 intervals was $2.89. Right in the range the Level 2 shows.
Lets get back to why this matters. When you see skips, the bigger the better. The bigger the skip, the “thinner” the Level 2 is. The more orders and prices in between, the thicker it is (Similar to the original clip of $SPY earlier). If this stock were to get a surge in volume, we could see it skip all the way to $3.45 from $2.86 relatively quick because there aren’t many orders in the way. (Look at the Ask column on the right)
If there were a lot of orders in between, that surge in volume has to eat its way through those orders. Can you run faster through a field with no trees, or a forest with hundreds? Less orders to fill, the faster it moves.
As with most things in the stock world, this is a tool in your belt, not a guarantee. Some big name traders use this more than anything else. If you take the time to watch a stock and see how its movement is linked to its Level 2, you can trade with confidence. It will help you be on the correct side of the MMs momentum in the future.