


There are dozens of different indicators that day traders swear by, but the VWAP may be the most common. The Volume Weighted Average Price (VWAP) creates a floating support and resistance that travels with the stock throughout the day. The VWAP is created by averaging the volume and the price using the equation below.
Fancy equations are nice and all, but why does this matter? Why does anyone care about a line on a chart that shows an average created by the volume and price? Because hedge funds (MMs) use it! That’s why. Because of that little fact, most traders use it also. At the end of the day, you should always try and follow the money. Similar to using L2 for trading. Always follow the money.
How do hedge funds actually use it? Contrary to popular belief, hedge funds typically don’t like moving prices. They will usually try to slowly sell into a wall or movement to keep their trades secretive. If everyone can see their trades out in the open, they can unintentionally create chaos. Big erratic price swings are no fun for hedge funds. Consider the amount of money they move around.
Since the VWAP is an average of price and volume, hedge funds will tend to sell above the VWAP and buy below it. Pretty common with most indicators right? Well with the VWAP, the volume portion is what separates it from the rest. Hedge funds will try to keep the sizes of their orders consistent to keep the price from jumping all over the place. That single attribute is why it can be such a strong support/resistance. The volume piece creates consistency in the movement, and that’s what we want. Consistency is easy to trade.
The price action around the VWAP will tell you what the big money is doing, and give you an indication of the future price movement.
If the price gets to the VWAP and falls through it, you can bet a bigger drop is on the way. If the price gets to the VWAP and bounces, you can expect a continuation upwards. The beauty of the VWAP is that it works both directions. Moving averages can provide similar strategies, but the VWAP is more consistent because of the addition of volume. Remember, volume creates movement. Lets see it in action.
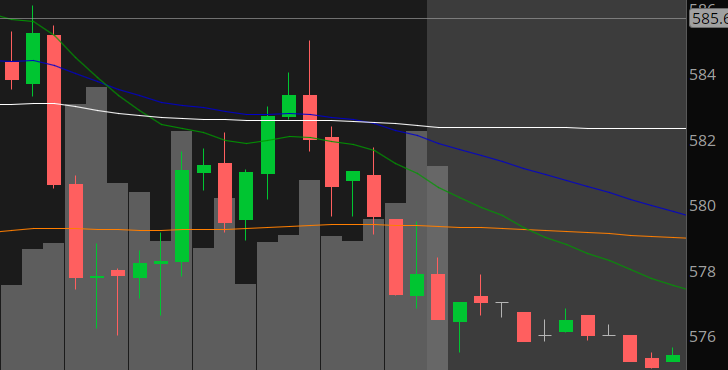
In the 5 min chart below, the VWAP is the white line. The green, blue, and orange lines are all MAs at 12/50/200 days respectively.

The trading throughout the day ebbed and flowed above the VWAP, and as you can see, it bounced right off of it twice. This quickly tells you what the money is doing. They are buying around that average. You can also see how the MAs didn’t really participate much. This is why the VWAP is another important tool. If you took that white line away, this chart wouldn’t make much sense would it?
There are a couple different strategies to trade around this. I personally use the VWAP to scalp. (Day trading only) If you don’t have a position, the VWAP is an excellent spot to buy with your stop set just below it. If you look at the first bounce, you would have made an easy .10. This works to the short side also. See below.
In this instance, when the price fell below the VWAP, it rocketed further down. Easy chance to short.
Basic rules of the VWAP scalp. If you see it bounce, buy. If it breaks downward, short. Your stops should be placed on the opposite side of the VWAP as your buy or short.
It sounds simple because it is.
The hard part of this strategy is not being greedy, and being mindful that the VWAP moves. You have to actively move your stop. The further you get away from the VWAP the more your profit, but you HAVE to take those profits though. You cant just ride the wave. Look at the range and understand the threshold. This particular stock made .10 range moves on almost every VWAP swing. This strategy involves you buying and selling multiple times.
As with everything, this is just one of many tools in your arsenal. Nothing is a guarantee, but consistency in your trading will turn into consistency in your wallet.
Share this if you liked it. Thanks.