


What are Supports and Resistance? In basic terms, support is where people are buying and resistance is where people are selling. These create floors and ceilings for the stock. Think of it as if you threw a rubber ball in a room. That ball is going bounce off the floor and the ceiling. Stocks do the same thing a large portion of the time.
Lets start with the floor. Supports.
You can easily see this on the chart when a stock repeatedly bounces off the same price point. Remember, “Always look left.” It will tell you the stock’s history. We all know history tends to repeat itself. The chart below shows a clear support line where the stock is bouncing: Illustrated by the arrows.
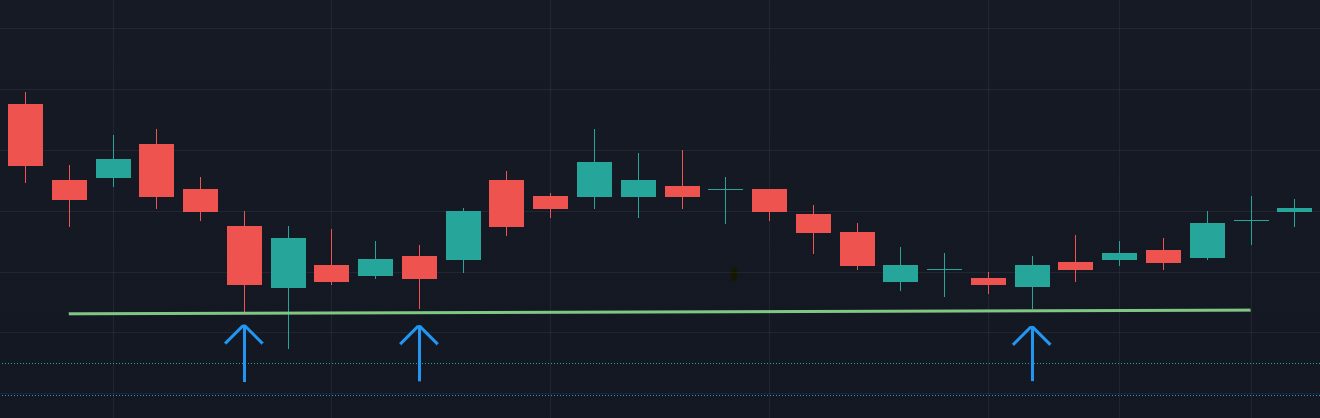
When you decide that you want to buy a stock, it is important to know where these points are. They can represent safe buying zones, and also give you a signal to exit your position. Often times if a stock falls below that support line, it will continue further to the next support level. Illustrated below.

Depending on how far the next support is, or how much you are willing to lose, you can set your orders to sell just below these support lines. Always protect yourself from larger drops. If you like a stock and want to buy more, you typically want to wait on the next support to do so.
Now lets talk about the ceilings. Resistance.
Resistance is represented by the peaks on the chart. This is the area that people are selling their shares and taking profits. That’s why you will see stocks struggle to pass a certain point. Trading around resistance can help you know when a stock is about to move higher. Similar to the way a stock may fall through support, it will do the same thing to the upside by breaking through resistance.

In the illustration above you can see a channel created by support and resistance. The stock bounced off the same resistance point (Ceiling) twice before finally breaking through on the third attempt.
One very important tip to remember with support and resistance is that once you break through a resistance point, it will often become a support. In the future when you “look left,” the previous peaks below the current price tend to act as a new floor. Illustrated below.

The first peak was initially a resistance, but once the stock pushed past that point, it became a strong support that the stock would bounce off three times before failing through it on the fourth.
Key take away: A break through resistance and a bounce off support are safe times to buy. Your exit strategy will be the opposite: A fall through support or a bounce off resistance are when you want to sell.
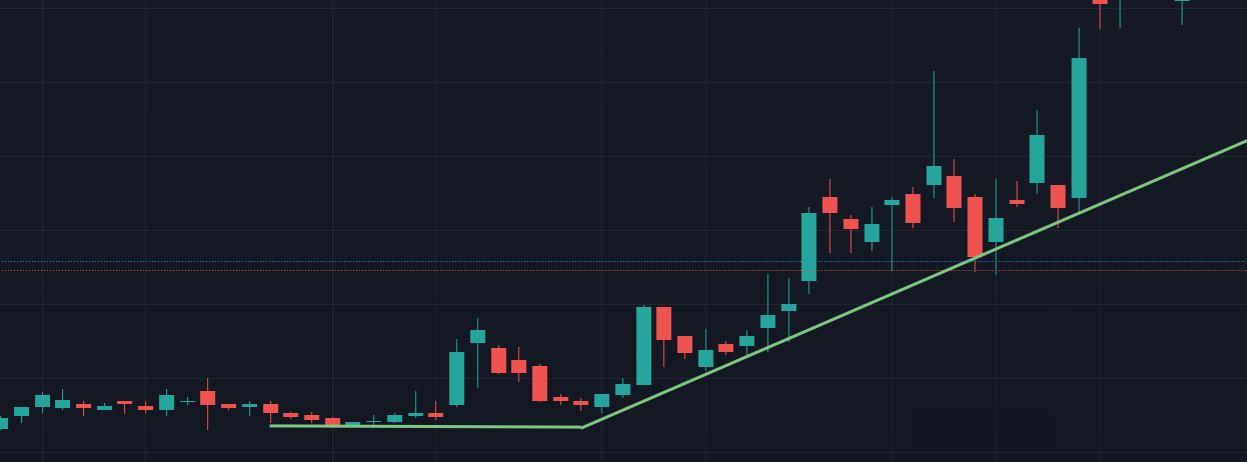
It is important to note that supports and resistances aren’t always driven by previous stock prices. Supports can follow a Trend Line, Moving Averages, Patterns, or may even become irrelevant because of sentiment or news. (Ill get into MAs and Patterns in another post)
Even the stock used in the previous illustration followed a trend line support to get to that first peak. See below.
Things like whole numbers can be resistance and support as well. Plenty of traders think “I’m not selling until this hits $10” or “Ill buy this if it drops to $2.” Often times when you look at Level II data you will see a large stack of sell orders on the next whole dollar amount higher and a large stack of buy orders on the next dollar amount lower.
Its important that you change the way you look at these charts. You need to be able to find supports and resistances in order to become a smart trader. They will allow you to decipher when it is a safe time to buy and when you should sell. That is ultimately the point right? By trading supports and resistance, you can limit how large your losses are.